Last updated: May 2026
Near miss reporting only becomes useful when the data leads to better decisions. Counting reports is a start, but report volume alone does not tell you whether risk is going down, whether crews trust the system, or whether corrective actions are working.
⚡ Quick Answer
- Do not only count volume: More near miss reports can mean more risk, better trust, or both.
- Track quality: Classification, severity potential, corrective action closeout, and repeat themes matter more than raw count.
- Use leading indicators: Near miss KPIs help leaders act before injuries and recordables show up.
- Connect to action: A metric is useful only if someone reviews it and changes work because of it.
What near miss KPIs should do
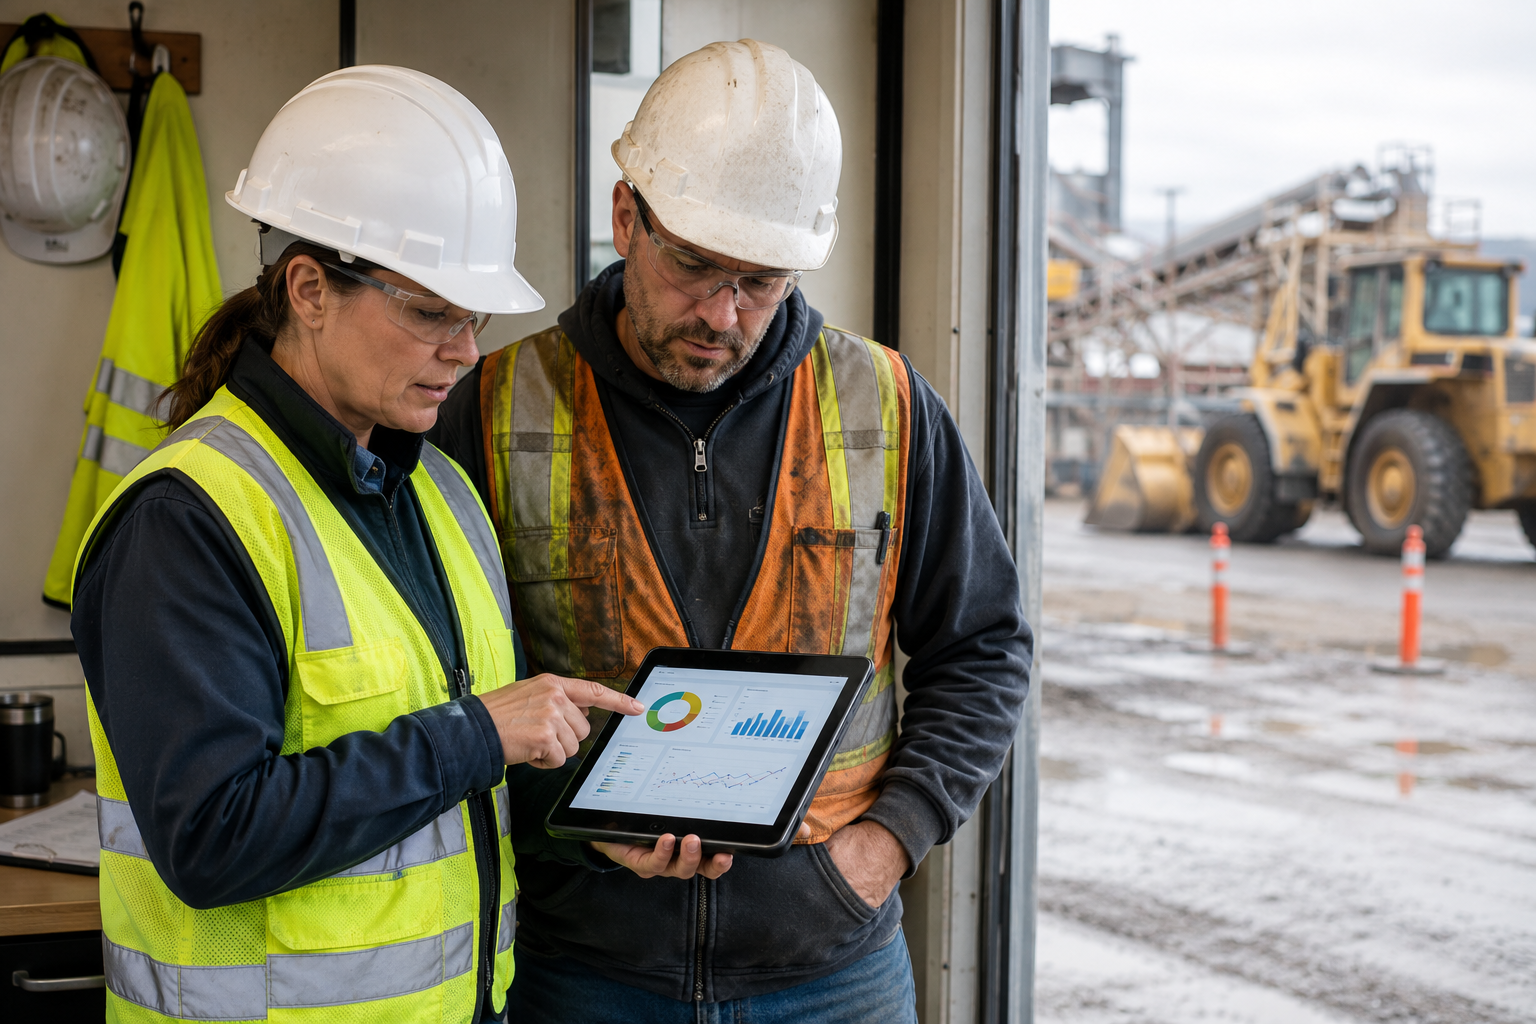
Near miss KPIs should show whether your organization is seeing risk early, responding consistently, and learning across sites. They should not exist only to make a dashboard look busy. A useful KPI helps a manager ask a better question: Where are controls failing? Which crews need support? Which corrective actions are overdue? Which serious exposures keep appearing?
For the full program context, start with the near miss reporting guide. For the intake structure behind the data, use the near miss report template.
The best near miss KPIs to track
| KPI | What it tells you | How to use it |
|---|
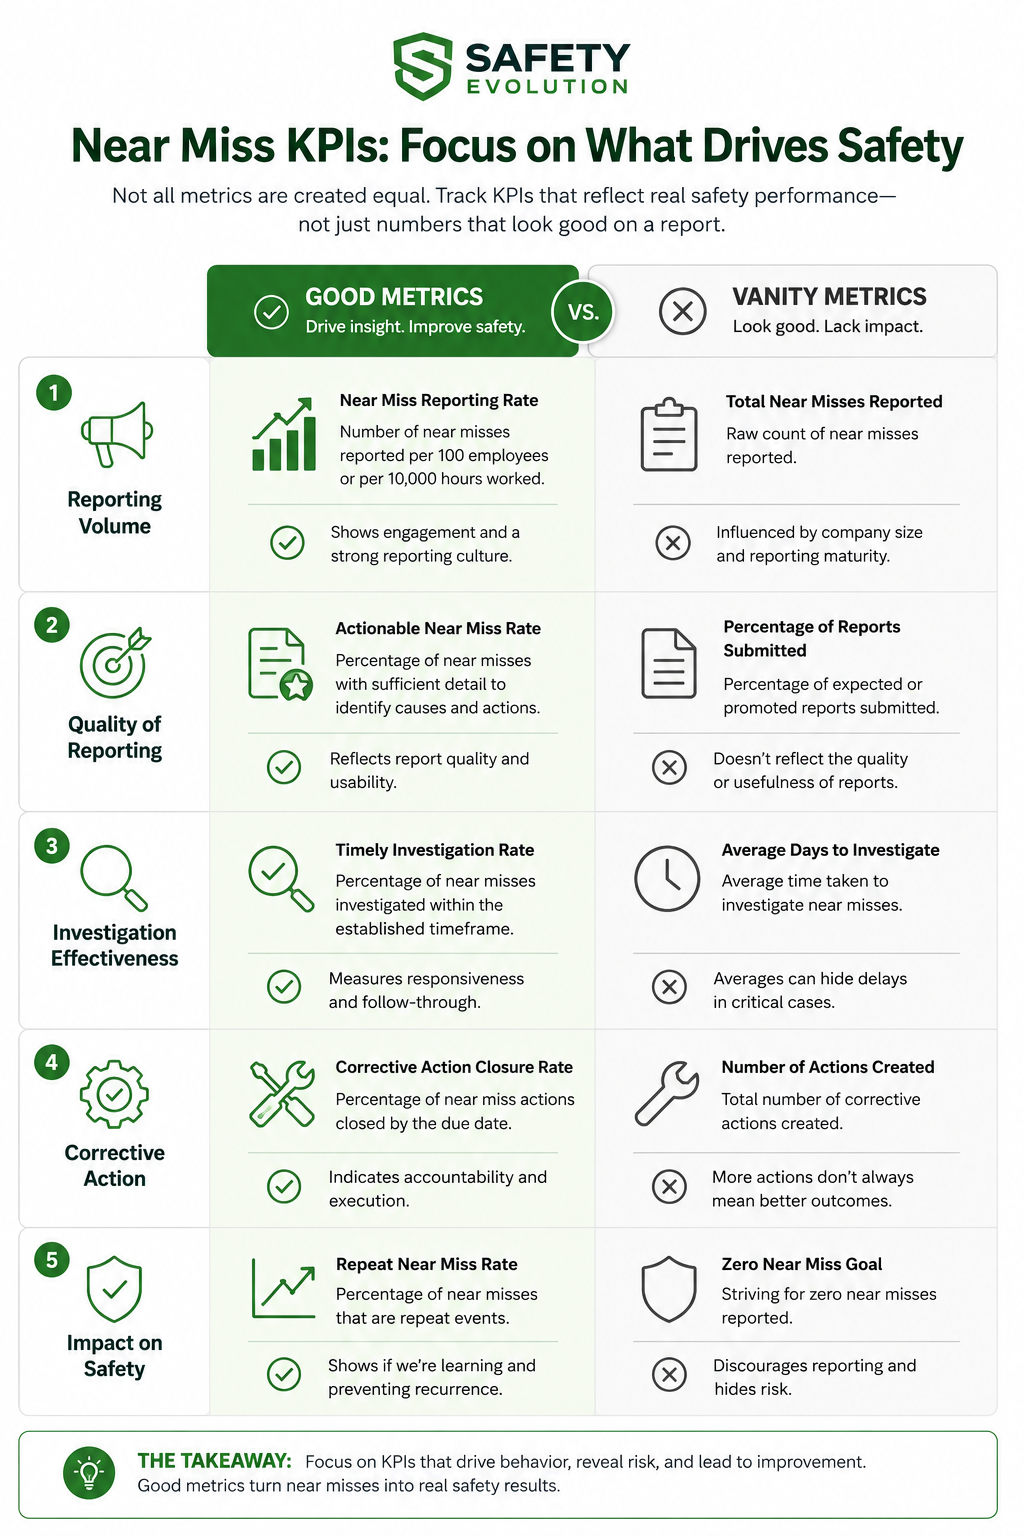
| Near miss reports submitted | Whether close calls are being captured. | Watch trends by site, crew, department, and job type rather than chasing a universal number. |
| Report rate by exposure hours | How reporting changes relative to work volume. | Compare similar sites or crews more fairly than raw count alone. |
| High-potential near misses | Where serious injury or fatality potential exists. | Review separately with leadership and connect to critical risk controls. |
| Corrective action closeout rate | Whether reports lead to action. | Escalate overdue actions and verify completion, not just assignment. |
| Average days to close | How quickly the organization responds. | Separate minor fixes from high-potential actions so speed does not hide quality. |
| Repeat near miss themes | Whether the same risk keeps coming back. | Use themes to adjust training, inspections, equipment, or planning. |
| Reporting source | Who is using the system. | Compare worker, supervisor, subcontractor, and management reporting to spot trust gaps. |
| Quality of report | Whether reports contain enough detail to act. | Coach teams on better descriptions, photos, risk potential, and corrective actions. |
Still relying on memory after close calls?
If near misses live in text messages, notebooks, or verbal updates, patterns disappear fast. Start your 30-day free trial and make reporting easier for supervisors and crews in the field.
Start Your 30-Day Free Trial →
Why near miss volume can be misleading
Many leaders want a simple number: more near miss reports equals better safety. It is not that simple. A rising near miss count can mean workers trust the process more. It can also mean risk is increasing. A falling count can mean controls are improving. It can also mean workers have stopped reporting because nothing happens after they submit.
This is why volume should always be read with context. Pair report count with severity potential, corrective action closeout, repeat themes, and site activity. If reporting doubles after a campaign and corrective actions are being closed, that may be a positive sign. If reporting drops while inspections show the same hazards, that may signal a culture problem.
Leading indicators versus lagging indicators
Injuries, recordables, lost time, and damage are lagging indicators. They show what has already gone wrong. Near miss reports are leading indicators because they can show weak controls before the loss occurs. The power of a near miss KPI is not that it replaces lagging indicators. The power is that it gives your team a chance to act earlier.
For example, three vehicle near misses in two weeks may tell you to review traffic plans before a backing incident causes injury. Repeated dropped-object near misses may tell you to improve overhead work controls before someone is hit. KPI review should turn those signals into action.
KPIs by role
Supervisors
Supervisors need simple indicators they can act on quickly: reports from their crew, open corrective actions, repeat themes, and high-potential items. The goal is not to make supervisors data analysts. The goal is to help them see what needs attention this week.
Safety managers
Safety managers need cross-site trend data: hazard category, task type, risk potential, location, closeout aging, investigation completion, and repeat causal factors. This helps them plan coaching, audits, campaigns, and leadership reviews.
Executives and owners
Executives need fewer numbers with stronger meaning: high-potential near misses, overdue serious corrective actions, repeat critical risks, and reporting participation. Those metrics help leadership see whether the safety system is learning before major events occur.
What not to track as a vanity metric
- Total reports without context. It can reward quantity without quality.
- Zero near misses. This often means under-reporting, not perfect safety.
- Closed actions without verification. A closed checkbox does not prove the control changed.
- Reporting competitions without trust. Incentives can create low-quality reports or discourage honest reporting.
- Only lagging indicators. Injuries alone do not show the warnings you missed.
How often should near miss KPIs be reviewed?
Supervisors should review open items weekly or even daily on active projects. Safety managers should review trends monthly. Leadership should review high-potential near misses, overdue actions, and repeated serious themes on a regular cadence. The frequency should match the risk and pace of work.
Metrics should also feed practical conversations. If your dashboard shows an increase in dropped-object near misses, that should become a field inspection focus, a toolbox talk, and a corrective action review. Use the near miss toolbox talk when you need to bring the data back to the crew.
How to improve KPI quality
Good KPI quality starts at the report. If the form does not capture hazard category, location, task, potential severity, immediate action, and corrective action owner, the dashboard will be shallow. The near miss reporting workflow should feed the metric structure you want to review later.
Consistency also matters. Use clear classifications from the near miss vs hazard page and the near miss vs incident page so the data is not polluted by mixed labels. Use the high-potential near miss guide so serious close calls do not get buried in total volume.
Turning metrics into prevention
The final test is action. If the KPI review does not change inspections, training, planning, supervision, maintenance, or purchasing decisions, it is not doing enough. A safety dashboard should help leaders see what crews are experiencing in the field and remove the conditions that make close calls more likely.
That is where digital reporting helps. When reports, photos, corrective actions, and dashboards live in one system, patterns are easier to spot and closeout is easier to manage.
Sample dashboard layout
A useful near miss dashboard does not need dozens of charts. Start with one leadership view and one supervisor view. The leadership view can show total near misses, high-potential near misses, serious corrective actions overdue, repeat themes, and trend by site. The supervisor view can show open actions, recent reports, recurring tasks, and items due this week.
That split matters because different roles need different decisions. A supervisor needs to know what to fix today. A safety manager needs to know where coaching is needed. An owner or executive needs to know where serious risk is repeating and whether the organization is closing the loop.
How to set targets without creating bad behaviour
Be careful with hard quotas such as "each crew must submit five near misses per month." Quotas can create low-quality reports and make workers feel the program is about numbers instead of prevention. A better target is participation and quality: Are crews reporting meaningful close calls? Are supervisors reviewing them? Are corrective actions closing? Are high-potential events getting escalated?
If you use targets, explain the purpose. The goal is not to manufacture reports. The goal is to make sure close calls are visible before someone gets hurt. Review the quality of examples, not just the count.
Review questions for management meetings
- Which near miss themes repeated this month?
- Which high-potential events need leadership support?
- Which corrective actions are overdue and why?
- Are reports coming from workers, supervisors, or only the safety team?
- Do any sites have unusually low reporting compared with exposure?
- What control will we improve before the next review?
Want better near miss reporting without more admin drag?
When reporting is clunky, supervisors skip it and crews stop believing it matters. Use Safety Evolution to capture close calls, assign follow-up, and keep the learning visible.
Start Your 30-Day Free Trial →
Frequently Asked Questions
What is a good near miss KPI?
A good near miss KPI helps leaders act before injuries occur. Useful examples include high-potential near misses, corrective action closeout, repeat themes, report rate, and average days to close.
Is a higher near miss count good or bad?
It depends. A higher count may show better reporting trust or increased risk. Review volume with context such as severity potential, exposure hours, repeat themes, and corrective action follow-through.
Should high-potential near misses be tracked separately?
Yes. They deserve separate review because the credible consequence is more serious than the actual no-loss outcome suggests.
How do near miss KPIs improve safety culture?
They show workers that reports are reviewed, trends are understood, and corrective actions are completed. That visibility can increase trust in the reporting process.