KPIs are the ROCKET FUEL for building a safe workplace!
Have you ever been tasked with building Key Performance Indicators (KPIs) for a safety program?
Developing KPIs can be daunting for anyone! It is such a big undertaking that there are multiple systems and books written on creating KPIs and other tracking metrics to make sure that your team is on track. On some of the projects that our team here at Safety Evolution has been on, the KPI Excel sheet had 20 tabs and then was linked into the main tracking Excel document!
So, where do you begin? How do you determine the top items that you need to track?
The place to start is to understand the leading and lagging indicators of workplace safety. Related: Safety Meeting Topics for Every Workplace.
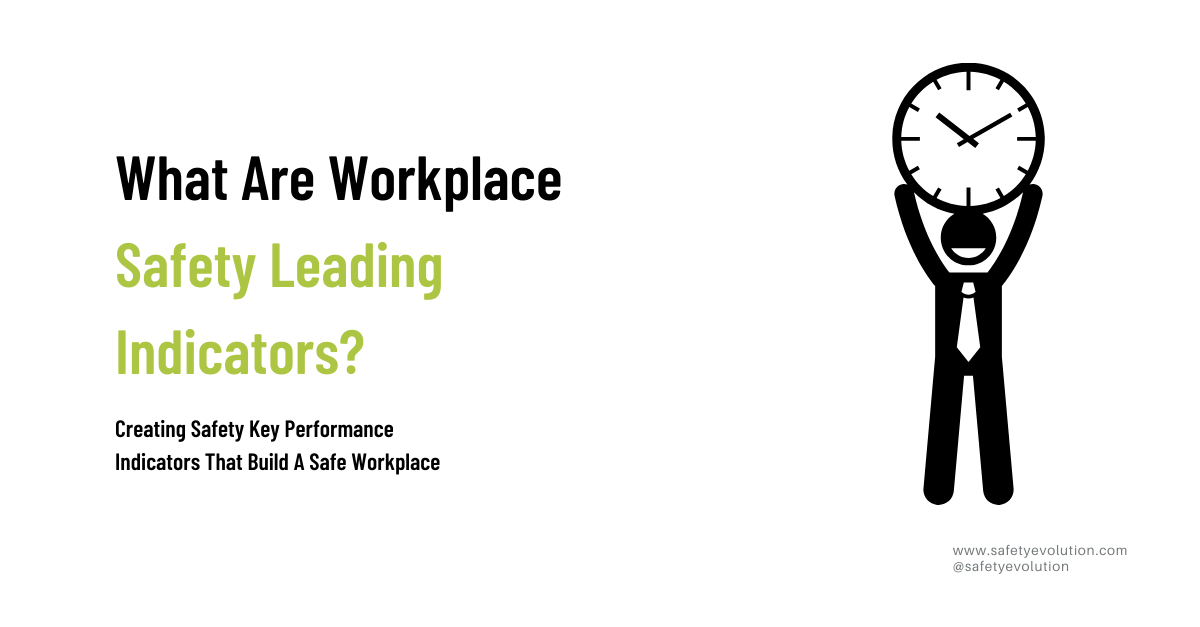
What Are Workplace Safety Leading Indicators?
Leading Indicators are the most relevant to business success and measure projecting performance.
We define Leading Indicators as - Proactive, preventative, and predictive measures that monitor and provide current information about the effective performance, activities, and processes of an EHS management system.
Leading Indicators drive the identification and elimination or control of risk in the workplace that can cause incidents and injuries.
In short, this means all the safety activities that you and your team do daily to stop events from happening. They could include anything you do to protect the safety of your team, such as Field Level Hazard Assessments (FLHA's), Inspections, Training, Competency Checklists, Safety Meetings, and Hazard Identification.
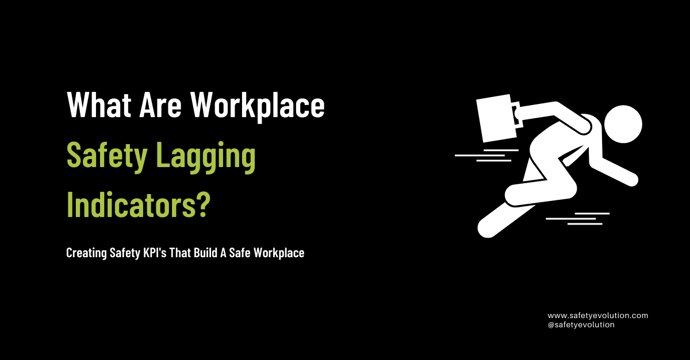
What Are Lagging Indicators For Workplace Health & Safety?
Lagging Indicators are passive and measure the success of past performance.
Lagging Indicators are defined as - Measuring the effectiveness of a company's health and safety program by tracking incident statistics.
Lagging Indicators tell you how all the effort your team made actually turned out. A great example is if you see your incident rates decreasing then you know that your efforts are working.
It is important to capture your leading and lagging indicators.
It doesn't work to just record one type of indicator. You need to make sure when you are building your Key Performance Indicators that you are capturing both lagging and leading in order to compare your performance over time
How Do I Find Which Safety KPI's I Should Use?
Tracking the wrong safety KPIs wastes time and hides real risk. SE-AI early access analyzes your operations data to identify the metrics that actually predict incidents on your sites.
Gathering and entering data for your Key Performance Indicators takes time and effort. It is important to begin this process by looking at your “WHY?”
Check out David Brennan, co-founder of Safety Evolution talking about his experience creating KPI's in the workplace below:
Start by finding the direction of the company. What is the business trying to do? What is the information that the management team or client requires? What are the challenges that you, as a safety professional, face? Learn more in our 8 Construction Safety Meeting Topics resource. What are you wanting to accomplish? For related guidance, see Download Free Toolbox Talks.
Once you have answered these questions, step back and think:
- How do these things relate to one another?
- How do they reflect the strength of your safety culture?
Key Performance Indicators, built with intention, help reduce workplace incidents and provide leadership with comparative data that motivates connection to the Safety Management program. KPIs keep workers up to date with safety trends and gives credibility to the company's safety culture. And last, but not least, KPIs shine a bright light on compliance issues.
What Should I Include In My Safety KPI's?
Let’s dig in and see how we can make the Safety Program work for the company. What needs to be measured? Will the data measured in the KPIs aid the company in reaching its goals?
Follow the SMART rules when setting your goals:
Specific
Measurable
Achievable
Relevant
Timely
Track data from the list below to develop Key Performance Indicators that will give a well-rounded overview of the company’s progress and a clear picture of the health of the safety culture.
Rate Of Injury
Lagging indicator but still very important and acts as a benchmark. Look at these numbers in relation to the number of employees, rate of occurrence, and frequency. The KPI for the rate of injury should be watched carefully when new equipment is introduced or when the work scope changes.
Near Misses
Goes a long way in accident prevention when reported correctly and is a measurable way to predict and plan for the prevention of future incidents and injuries. Learn more in our Incident Report & Investigation Kit resource. Important reporting channel generates employee involvement. Positive reinforcement should be given to employees involved in near-miss reporting.
Safety Inspections & Audits
When done regularly they ensure due diligence. What is the finding of safety audits?
Corrective Actions
Not just “fixing” issues but using these to look at patterns in the workplace. Take a good look at the hierarchy of controls and determine if existing controls have been adequate.
New Employee Training
Here we not only track new employee training but also assess the effectiveness of this training by measuring ongoing understanding and adherence to the procedures taught in the training. The information gathered from BBOs can be fed into your Training data to track the retention of your training content. You can re-evaluate training methods if retention declines. Remember, training is an administrative control in the hierarchy for keeping workers safe!
Employee Wellness
Let's not forget the HEALTH component of Occupational Health and Safety. Include the absentee rate due to illness and reduced performance when employees come to work ill measures against the standard productivity rate.
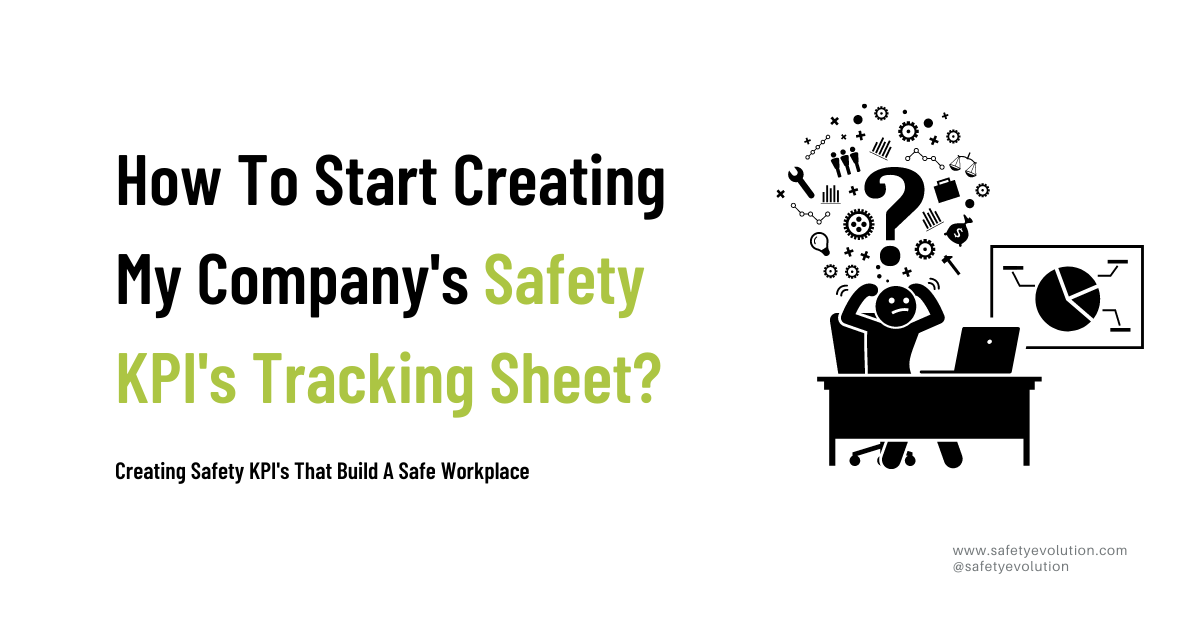
How To Start Creating My Company's Safety KPI's Tracking Sheet?
1. Each Key Performance Indicator that you build must align with a goal or target of the business.
Begin with a spreadsheet format or safety software to convert your data into useful metrics for your KPI dashboard. Use formulas to develop the analytics for your targets. For example:
Lost Time Injury Frequency Rate (LTIF):
The number of lost time injuries that happen per million hours: Multiply the number of lost-time injuries by 1,000,000 then divide by the total number of hours worked in an organization.
Your safety KPIs should drive action, not just fill reports. SE-AI early access turns your safety data into actionable leading indicators.
Lost time injuries X 1,000,000
______________________________ = LTIFR
Total hour worked
2. Remember that KPIs are developed as a way to communicate! Share KPIs with your stakeholders.
3. Consistently review the data captured in the KPIs. Does the information provide the analytics needed to successfully move toward the associated target?
4. Key Performance Indicators should be actionable. Schedule regular reviews. Develop a process for correction and accountability.
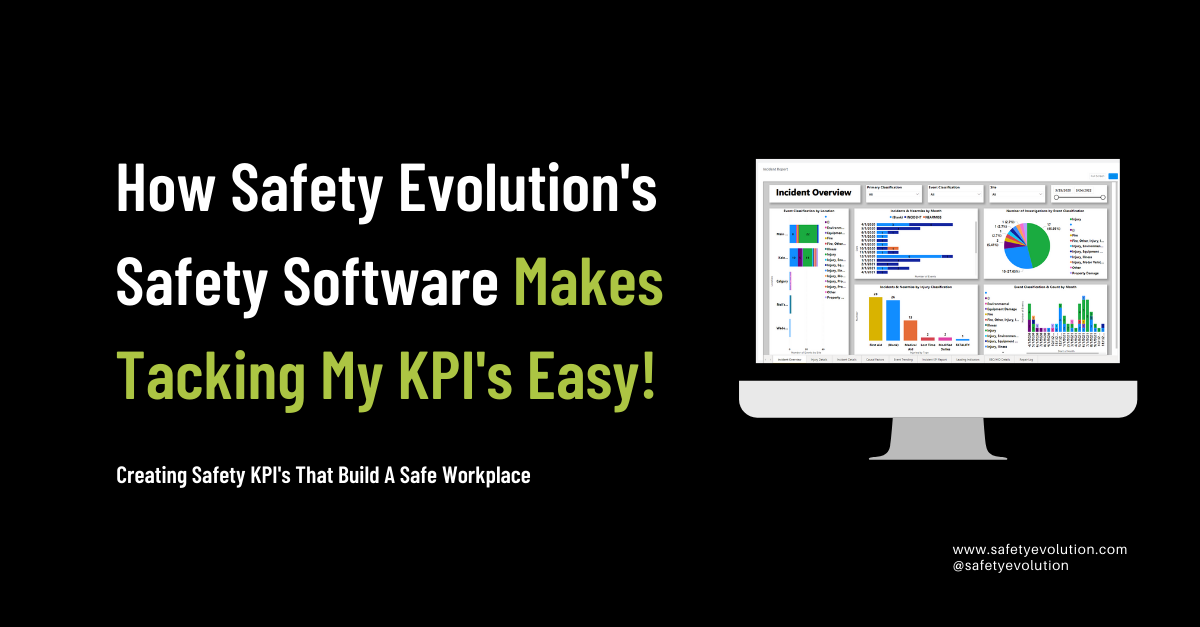
How Safety Evolution's Safety Software Makes Tacking My KPIs Easy!
One of the biggest challenges of creating and managing KPIs is the administrative workload of capturing all the data.
How do you find a way to easily capture KPIs?
The answer is to move to Safety Management Software. The Safety Evolution Safety Management Software automatically gathers this information and provides it to you updated every day.
This means that the hours you would usually need to gather and document safety KPIs are saved. Imagine never filling out excel spreadsheets again!
STOP WASTING TIME FILING PAPER FORMS - HAVE OUR TEAM DIGITIZE YOUR FORMS FOR FREE.
Sign up to receive our weekly newsletter with helpful safety content below!
Get Weekly Safety Insights
Join safety professionals across Canada and the US who get our field-tested compliance tips, regulatory updates, and toolbox talk ideas every week.