Health & Safety Program
Calculate Your OSHA Dart Rate!
DART rate formula, 2024 benchmarks, and how to read your OSHA 300 log for DART cases. Understand what separates DART from TRIR.
Learn the three OSHA incident rates every contractor needs: TRIR, DART, and DAFW. 2024 BLS benchmarks, formulas, and how they affect bids.
Last updated: April 2026
OSHA incident rates are the common language of workplace safety performance. When a general contractor reviews your prequalification package, when ISNetworld flags your company, when your insurance broker calculates your premium, they are all looking at the same set of numbers: TRIR, DART, and EMR.
OSHA incident rates are standardized metrics that measure workplace injuries and illnesses relative to the number of hours worked, allowing companies of any size to be compared on the same scale. The rates are calculated using formulas established under 29 CFR 1904 and published annually by the Bureau of Labor Statistics.
OSHA and the Bureau of Labor Statistics use three primary incidence rates to measure workplace safety. Each uses the same formula structure but counts different types of cases.
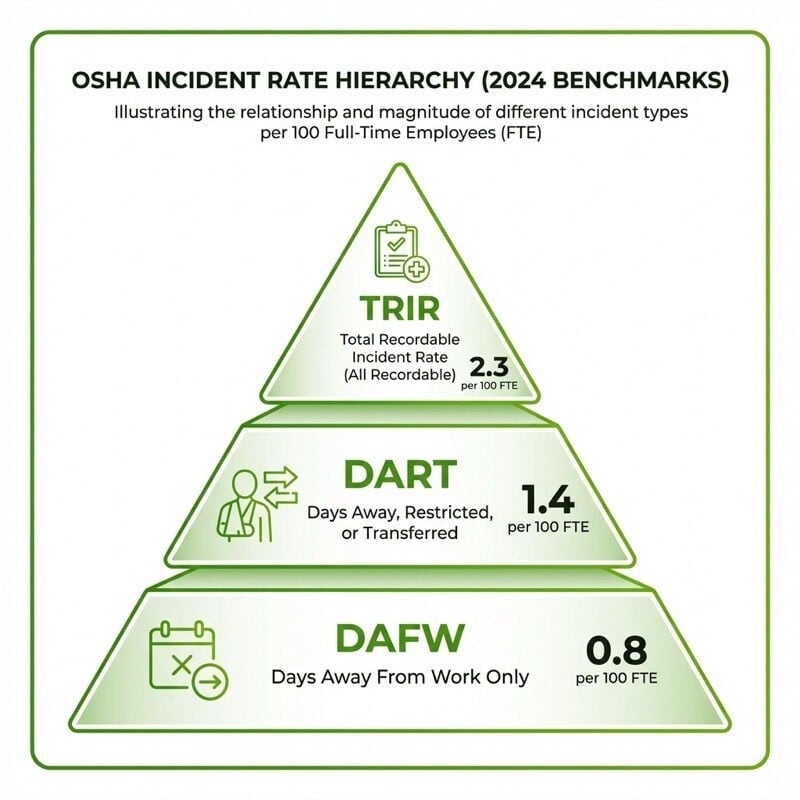
TRIR counts every OSHA-recordable case: any work-related injury or illness that results in medical treatment beyond first aid, days away from work, restricted work, job transfer, loss of consciousness, or a significant diagnosis by a physician.
Stop Treating Near Misses as "No Big Deal"
Every near miss is a free warning. Download our free Incident Investigation Kit to capture the details before it turns into a recordable accident.
Download the Free Investigation Kit →Formula: TRIR = (Recordable Cases x 200,000) / Total Hours Worked
TRIR is the broadest measure. It tells you how often incidents happen. It is the most commonly requested rate on prequalification forms and bid packages. For a complete walkthrough, see our TRIR calculation guide.
DART counts only the cases where the worker's ability to do their job was affected: they missed work, were put on restricted duties, or were transferred to a different role.
Formula: DART Rate = (DART Cases x 200,000) / Total Hours Worked
DART is a severity filter on TRIR. A company with a high TRIR but a low DART is experiencing frequent but minor incidents. A company where DART and TRIR are close together is experiencing mostly severe incidents. See our DART rate guide for the full breakdown.
DAFW counts only the cases where the worker actually missed scheduled workdays. It excludes restricted-work and transfer cases.
Formula: DAFW Rate = (Days-Away Cases x 200,000) / Total Hours Worked
DAFW is the strictest severity measure. It only counts cases where the injury or illness was serious enough to keep the worker off the job entirely. The 2024 national DAFW rate was 0.8 per 100 FTE (National Safety Council, 2024).
The Bureau of Labor Statistics publishes incidence rates annually through the Survey of Occupational Injuries and Illnesses (SOII). The most recent data covers 2024 (BLS, published January 2026).
All private industry (2024):
All three rates hit record lows in 2024, continuing a downward trend that has persisted for over two decades.
Construction (2024):
Construction matched the national average in 2024, a significant improvement from historical rates that frequently exceeded 3.0. Specialty trade contractors and heavy/civil engineering construction tend to have higher rates than general building construction.
You can compare your company's rates to BLS benchmarks using the BLS Injury and Illness Incidence Rate Calculator, which allows industry-specific comparisons by NAICS code.
Incident rates serve three distinct purposes for contractors:
ISNetworld, Avetta, ComplyWorks, and most GC prequalification processes require three to five years of TRIR, DART, and EMR history. Many general contractors set hard thresholds. If your TRIR exceeds their cutoff (commonly 1.0 to 2.0 depending on project type), your bid is rejected before pricing is reviewed.
Your experience modification rate (EMR) is calculated from the same underlying claims data that drives your incident rates. A contractor with consistently high TRIR and DART rates will see their EMR climb over the following 12 to 24 months, increasing workers' compensation premiums. For the full EMR breakdown, see our EMR in construction guide.
Tracking TRIR and DART quarterly gives you a trend line. Rising rates signal that your safety program is losing effectiveness. Falling rates validate that prevention efforts are working. The rates are most useful when compared against your own historical performance, not just industry averages.
All incidence rates start with the OSHA 300 log (Log of Work-Related Injuries and Illnesses). Employers with 11 or more employees are required to maintain this log under 29 CFR 1904.
The 300 log columns that drive each rate:
When calculating your rates, make sure you are counting from the correct columns. A common error is including Column J cases in the DART count, which inflates the rate.
Use our free TRIR calculator to quickly compute your rates from your 300 log data.
Incident rates are lagging indicators. You improve them by strengthening the leading indicators that prevent incidents from occurring in the first place.
Stop Blaming "Worker Error"
If your investigations always end with 'the worker needs to be more careful', you are missing the root cause. Get our free Incident Investigation Kit to use the 5-category framework and uncover the real issues.
Download the Free Investigation Kit →The standard OSHA incidence rate formula is: (Number of Cases x 200,000) / Total Hours Worked. The 200,000 represents 100 full-time employees working 40 hours per week for 50 weeks per year. This formula applies to TRIR, DART, and DAFW calculations, with the only difference being which cases are counted in the numerator.
The 2024 TRIR for construction was 2.3 per 100 full-time equivalent workers, according to the Bureau of Labor Statistics. This matches the all-industry average and represents the lowest construction incident rate on record. Specialty trade contractors tend to have higher rates than general building contractors.
Most prequalification platforms (ISNetworld, Avetta, ComplyWorks) and general contractors require three to five years of TRIR, DART, and EMR data. Many GCs set hard TRIR thresholds, typically between 1.0 and 2.0 for construction. If your rates exceed the threshold, your bid is rejected regardless of pricing or capabilities.
The 200,000 figure represents 100 employees working 40 hours per week for 50 weeks per year (100 x 40 x 50 = 200,000). It normalizes incident counts so companies of different sizes can be compared on the same scale: incidents per 100 full-time equivalent workers per year. This standard was established by OSHA under 29 CFR 1904.
Calculate TRIR and DART at least quarterly for internal trend tracking. Many contractors calculate monthly during high-activity periods. For prequalification, you will need annual rates for the past three to five years. OSHA requires you to post your annual summary (OSHA 300A) by February 1 each year, covering the previous calendar year.
Get Weekly Safety Insights
Regulation updates, toolbox talk ideas, and compliance tips. One email per week.
DART rate formula, 2024 benchmarks, and how to read your OSHA 300 log for DART cases. Understand what separates DART from TRIR.
Learn how to calculate your Total Recordable Incident Rate (TRIR), what the OSHA formula is, and what a good TRIR score means for contractors.
Explore the core elements of an IIPP program: management commitment, hazard correction, employee participation, and more. Build a safer workplace...